Dashboard
A real-time overview of your workspace usage — calls made today, plan capacity, and historical trends.
Overview
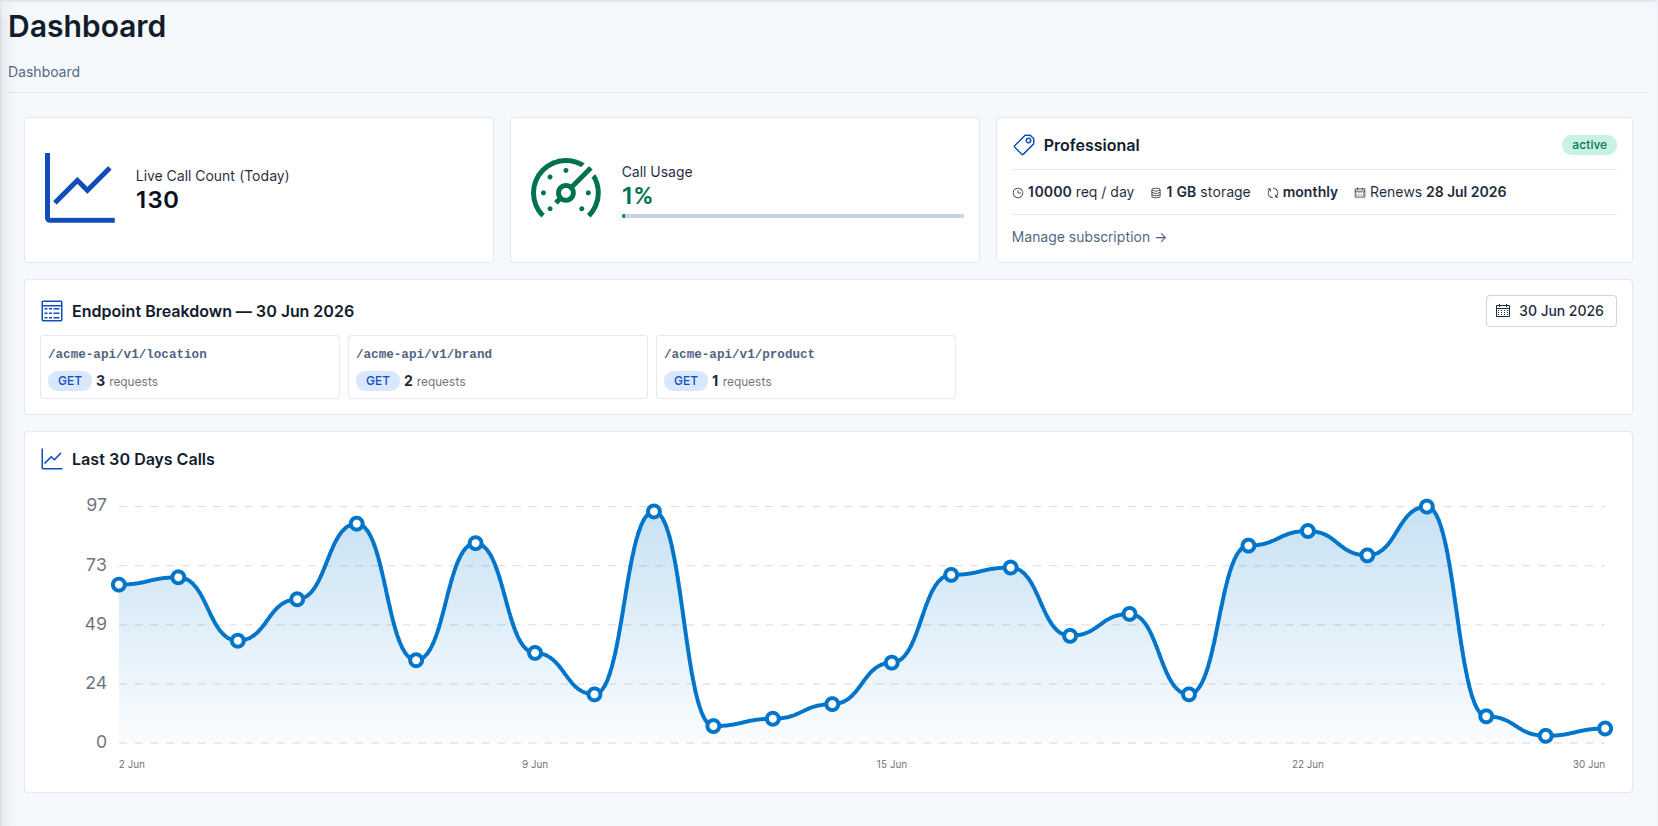
The Dashboard is the first page you see after logging in. It gives you an at-a-glance picture of how your APIs are being used and the current state of your subscription.
 Dashboard
Stat Cards
Two summary cards appear at the top of the page:
-
Live Call Count (Today) — total number of API requests received today across all your endpoints.
-
Call Usage — today's calls as a percentage of your plan's daily request limit. The progress bar turns yellow above 70 % and red above 90 %.
Usage Alerts
SearchAPI automatically sends an email notification when your daily call usage crosses these thresholds:
-
90 % — warning: you are approaching your daily limit.
-
100 % — limit reached: your plan's daily request quota is used up.
-
110 % — requests are cut off: API calls beyond this point are rejected until the daily counter resets. An email is sent at this threshold as well.
Emails are sent to the workspace owner's address. To increase your daily limit, upgrade your plan from the Subscription page.
Plan Card
Next to the stat cards, the plan card shows your current subscription at a glance: plan name, status badge, requests per day, storage limit, billing interval, and next renewal date. A link at the bottom takes you directly to the Subscription page to upgrade or manage your plan.
Endpoint Breakdown
Below the stat cards, the Endpoint Breakdown panel lists every endpoint that received traffic, grouped by API / version / model path. For each group you can see the HTTP method (GET, POST, PUT, PATCH, DELETE) and the number of requests it handled.
By default the panel shows today's data. Use the calendar button in the panel header to pick any past date and view that day's breakdown instead.
Last 30 Days Calls
The line chart at the bottom shows total daily call volume for the past 30 days. Hover over any point on the chart to see the exact date and call count in a tooltip.